Understanding the Importance of Formatting as a Table
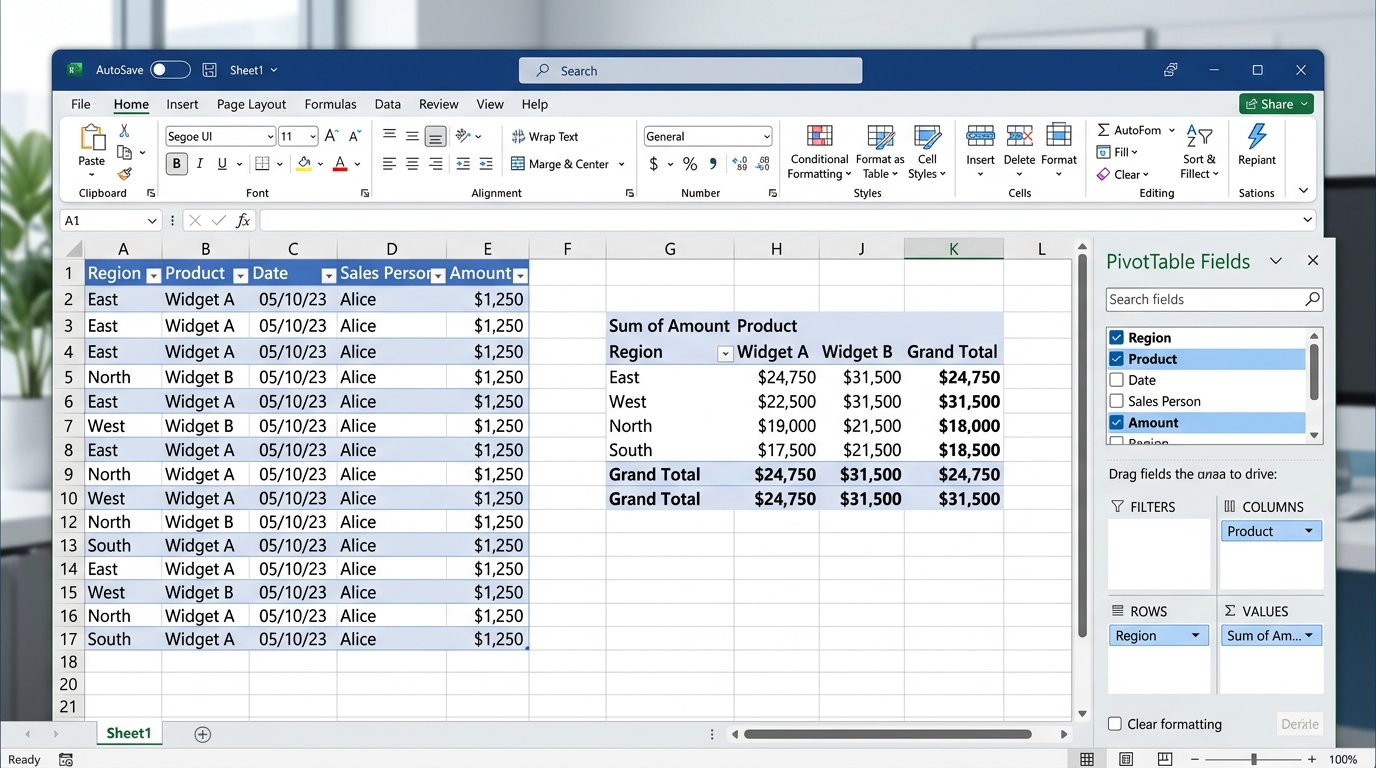
When it comes to managing data in Excel, proper formatting can make all the difference. Ever tried sifting through a massive spreadsheet with no structure? It's like searching for a needle in a haystack! That’s why I always recommend using the "Format as Table" feature. Not only does it enhance readability, but it also unlocks some nifty filtering and sorting capabilities.
But beyond just aesthetics, formatting as a table helps with calculations and data management. For instance, in financial reports, having a well-structured table allows for smoother data manipulation during analysis. Let’s jump into the nitty-gritty of how to format your data correctly.
Getting Started: Formatting Your Data as a Table
Before you can get all fancy with styles and filters, you need to format your data properly. Here's a simple step-by-step guide that even your grandma could follow:
- Select your data range. Make sure to include headers, as they will become the first row of your table.
- Press
Ctrl + Ton your keyboard. This shortcut is your best friend! - A dialog box will pop up, confirming your selection. Make sure the checkbox for "My table has headers" is checked.
- Click "OK" and voilà! You now have a table.
In Excel 2021, this process is as seamless as it gets. The interface is user-friendly, so you can focus on analyzing data instead of fumbling through menus.
Choosing the Right Table Style
I’ve found that picking the right style can be a game-changer. Excel offers a variety of pre-designed styles that not only look good but also enhance the functionality of your tables. Here's how to try them out:
- With your table selected, go to the Table Design tab (or Design tab in older versions).
- Explore the Table Styles gallery and hover over each one to see a live preview.
- Once you find one you like, just click it to apply!
It's important to note that in Excel 2019, while you have a rich selection, some advanced styles are only available in Excel 365. So if you're tempted to upgrade, just think about those snazzy styles!
Utilizing Filtering Options
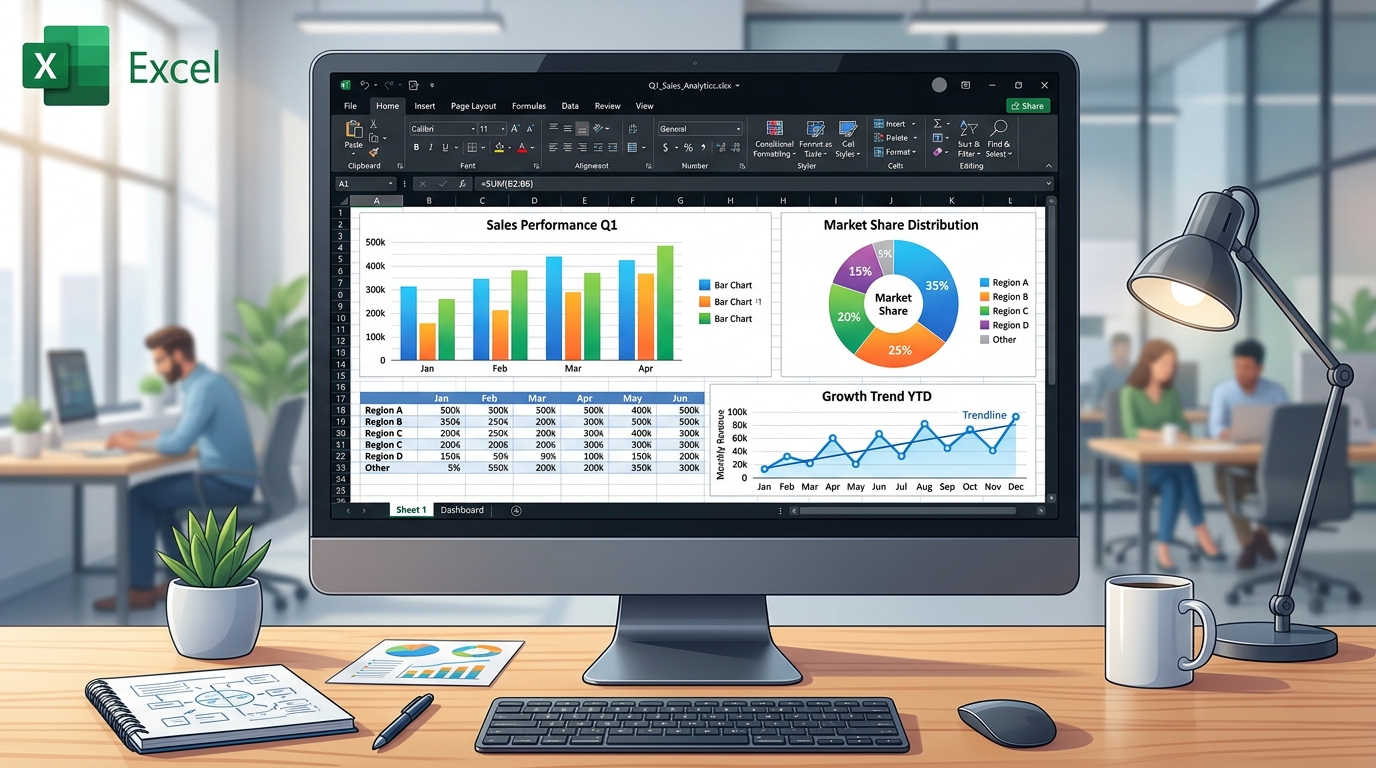
Now that your data is all dressed up, it’s time to put those filtering capabilities to work. Filtering lets you view only the data you need without the clutter. Here’s how to filter your table:
- Click on the small drop-down arrow next to one of your header names.
- Select the criteria you want to filter by. For example, if you’re managing sales data, you can filter by sales rep or date.
- Hit "OK," and just like that, only the relevant data will show up!
In Excel versions prior to 2019, filtering was often a multi-step process. But with the introduction of the filtering feature in tables, it’s as easy as pie. Trust me, this will save you precious time, especially when working with large datasets.
Common Pitfalls to Avoid When Formatting Tables
While formatting your data as a table can be cathartic, there are some hiccups you’ll want to sidestep:
- Forgetting Headers: Always ensure your first row contains headers. Otherwise, you might end up with some confusing results.
- Overlooking Data Type: Make sure your data is consistent. For instance, if you're tracking sales figures, ensure all entries are numeric, or filtering will drive you bonkers.
- Ignoring Table Properties: In Excel 365, you can set properties like banded rows or total rows in the Table Design tab. Utilize these features!
Dica DomineTec: Always double-check your filters! I’ve had countless moments where I thought I was looking at fresh data only to realize I had a filter applied that hid vital entries.
Sorting Data for Enhanced Analysis
Once you’ve filtered your data, sorting it can further refine your analysis. You can sort your table in ascending or descending order based on any column. Here’s how:
- Just like filtering, click the drop-down arrow next to the column header.
- Select "Sort A to Z" or "Sort Z to A" based on your needs (like sorting sales data from highest to lowest).
- Watch your data rearrange like magic!
In my experience, sorting is crucial when you want to present data to stakeholders. It helps in identifying trends and anomalies quickly.

Advanced Features for Table Management
If you’re feeling adventurous, there’s a whole world of advanced features available in Excel, especially with the newer versions. Here are a few worth exploring:
- Structured References: Instead of cell references, Excel allows you to use table names. For example, instead of writing
=A2+B2, you can use=Sales[Amount]for clarity. - Calculated Columns: You can create a formula in one cell and drag it down to fill the entire column. It’s a huge time-saver.
- PivotTables: If your data is extensive, consider summarizing it with PivotTables. This feature offers versatile data analysis.
Utilizing these advanced features can significantly enhance your productivity and data management skills. Don’t be scared to explore; you might just stumble upon a tool that will revolutionize how you work with data!
Advanced Techniques for Formatting as Tables in Excel 365
When working with large datasets, standard methods might not always cut it. In my experience managing complex financial reports, leveraging the advanced features of Excel 365 makes a world of difference. You might have noticed that basic approaches can sometimes slow down your spreadsheet, especially when dealing with thousands of rows. But why settle for less when you can optimize?
One trick I always recommend is combining your standard process with dynamic arrays if you're on a newer version. For instance, using shortcuts like Ctrl+Shift+L to toggle filters before you apply any major transformations can save you from accidental data loss. Have you ever applied a change only to realize it affected hidden rows? It's a nightmare. Always ensure your data is visible. Moreover, utilizing the Alt+F11 shortcut to peek into VBA can open up possibilities for automation, even if you just record a macro initially.
Another aspect often overlooked is the power of Named Ranges. Instead of referencing standard cell arrays, giving them a meaningful name makes your formulas readable and your processes less error-prone. This ties directly into mastering Formatting as Tables. When you apply these methods, not only does your spreadsheet run faster, but your colleagues will also thank you for making the data easier to understand. Always remember to use Ctrl+Z if things go sideways, but with careful planning, you won't need it often.
Common Pitfalls and Troubleshooting Formatting as Tables
Even seasoned professionals run into issues when dealing with Formatting as Tables. Just last week, while working on an inventory management dashboard, a colleague spent hours trying to figure out why their data wasn't aligning correctly. The culprit? Hidden characters and trailing spaces. Before you dive deep into your workflow, always consider running the TRIM() and CLEAN() functions on your raw data.
DomineTec Tip: Always clean your data before applying complex operations. A simple =TRIM(A2) can save you hours of debugging!
It's fascinating how different versions, like Excel 2019 versus Excel for Mac, handle background processing. Sometimes, what works seamlessly on a PC might require a slight adjustment on a Mac. If you're using keyboard shortcuts, remember that Mac users often rely on Cmd instead of Ctrl. Have you ever tried sharing a workbook only to find the formatting completely broken on the recipient's end? This usually happens due to version incompatibility or unsupported features.
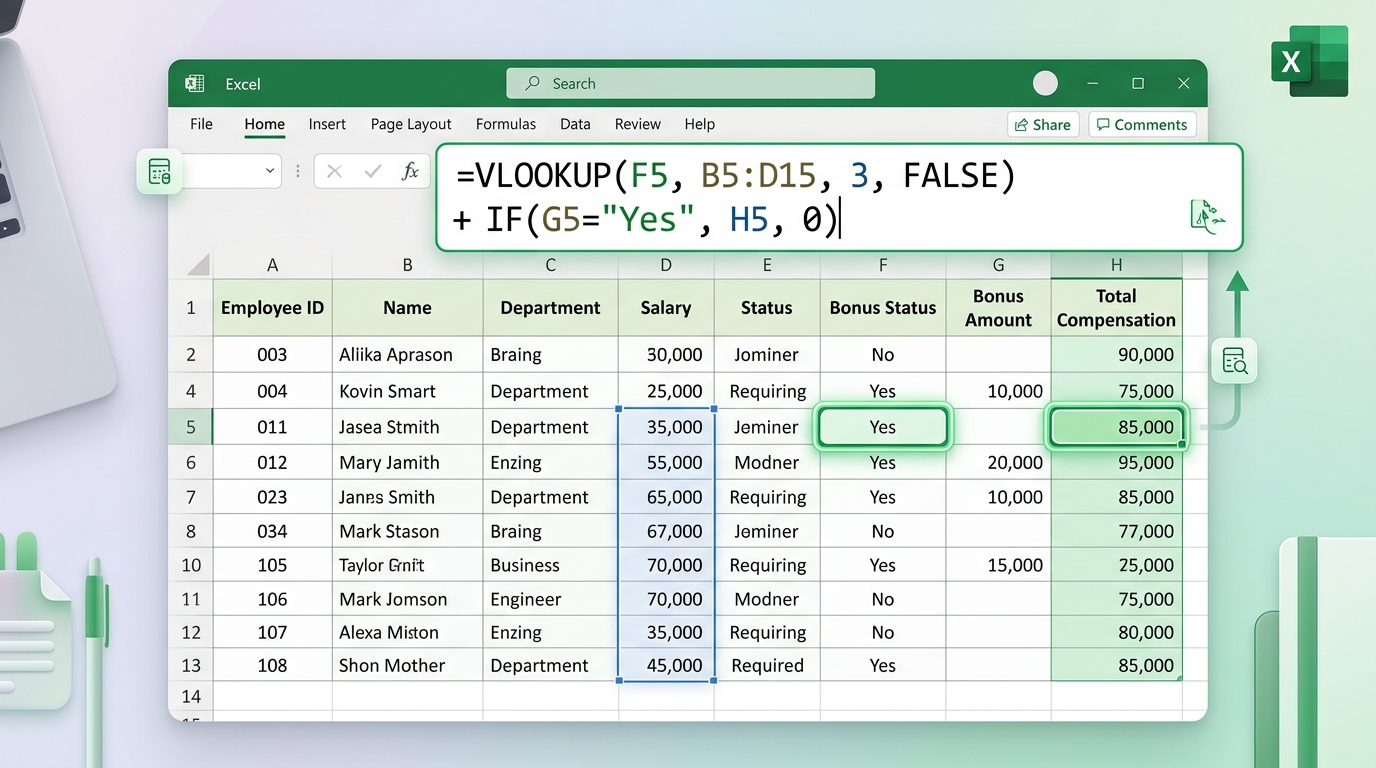
To avoid these pitfalls, I always advise saving a backup copy of your data (F12 is your best friend for a quick Save As). Whether you are formatting cells, writing complex syntax like =VLOOKUP(A2,Sheet2!$A:$D,3,FALSE), or simply adjusting your print area, having a fallback ensures you never lose critical work. Troubleshooting doesn't have to be daunting if you approach it systematically.
Optimizing Workflow with Formatting as Tables
Let's talk about efficiency. In the modern workplace, speed is just as important as accuracy. When I first started working with Excel Online, I realized that optimizing my workflow was crucial for collaborative projects. Managing Formatting as Tables effectively means less time clicking around and more time actually analyzing the results.
Consider the use of Excel Tables (Ctrl+T). When you convert your standard range into a table, any new data added automatically inherits the formatting and formulas. This is a game-changer for dynamic datasets like HR tracking or weekly sales reports. Why manually drag down formulas when Excel can do it for you? Furthermore, integrating these tables into your daily routine reduces the risk of human error.
Beyond tables, understanding absolute and relative referencing is vital. Pressing F4 to lock your cell references (like changing A1 to $A$1) ensures that when you copy your logic across columns, it points exactly where it should. Combining these fundamental practices with Formatting as Tables will elevate your spreadsheet skills from average to expert level, impressing your boss and saving you countless hours.
Integrating Formatting as Tables into Daily Operations
One of the most frequent questions I get asked is how to make these skills stick. The answer is integration. You shouldn't just learn about Formatting as Tables and forget it; it needs to become a part of your daily muscle memory. For example, if you manage a sales dashboard, make it a habit to check your data integrity every morning using the techniques we've discussed.
If you're still using legacy systems or older versions like Excel 2016, you might find some newer functions missing. However, the core logic remains the same. You can always use alternative methods, such as combining INDEX and MATCH if newer lookups aren't available. It's about being adaptable. "The only constant in technology is change," as they say, and Excel is no exception.
DomineTec Tip: Build a template for your most common tasks. Having a pre-formatted structure allows you to focus on the data rather than the setup.
Finally, don't underestimate the power of visual feedback. Using Conditional Formatting alongside your main tasks can immediately highlight anomalies or trends. Setting up rules to flag duplicate entries, highlight top performers, or identify missing data makes your work not just functional, but visually compelling. When Formatting as Tables becomes second nature, you'll wonder how you ever managed without it.
Real-World Examples: Formatting as Tables in Action
Theory is great, but practical application is where the magic happens. Let's look at a scenario involving a mid-sized retail company. They were struggling with consolidating their monthly sales reports. By applying the principles of Formatting as Tables, they managed to reduce their reporting time by 40%. It's incredible what a few well-placed formulas and organized data structures can achieve.
In another case, an HR department needed to track employee attendance and performance metrics across different branches. They utilized Excel 365's collaborative features, allowing multiple managers to input data simultaneously. By enforcing strict data validation and using the techniques discussed here, they eliminated inconsistencies. They used formulas like =COUNTIFS(B:B, ">"&TODAY()-30, C:C, "Present") to dynamically track recent activity.

These aren't just isolated incidents. Whether you are a student managing a budget, a small business owner tracking inventory, or a corporate analyst dealing with big data, the application of Formatting as Tables scales to your needs. The key takeaway here is that Excel is a versatile tool, and mastering its nuances empowers you to tackle almost any data challenge with confidence.
FAQs about Formatting as Table in Excel
What is the difference between a range and a table in Excel?
A range is simply a collection of cells, whereas a table is a structured range with specific functionalities like sorting, filtering, and using structured references. Tables make data management much easier!
Can I format an existing range as a table?
Absolutely! Just select your range and follow the same steps we went through to format it as a table. Excel will automatically convert your selected range into a table.
Will formatting as a table affect my existing formulas?
Not at all! Your existing formulas will remain intact, but they will benefit from the table’s structured references, making them easier to read and manage.
Can I change the style of my table after formatting?
You bet! Simply click on the table, go to the Table Design tab, and you can change the style anytime. It’s that easy!
Are there any limitations to tables in Excel?
While tables are incredibly powerful, they do have limits, such as a maximum of 1,048,576 rows per table. If you hit that cap, you might have to separate your data into multiple tables.