How to Use Downdetector to Check If a Website or App Is Down
How to Use Downdetector to Check If a Website or App Is Down
When messages fail to deliver, websites refuse to load, or banking applications display unexpected error screens, diagnosing whether the issue is local to your Wi-Fi/cellular network or an actual service outage is vital. Downdetector provides real-time outage tracking for thousands of digital platforms worldwide.
What Is Downdetector and How Does It Work?
Downdetector is an independent service status tracking platform that collects, processes, and displays real-time outage reports submitted by users. Instead of relying solely on delayed official status pages, Downdetector tracks user complaint spikes across multiple sources:
- Direct User Incident Reports: Reports submitted by users clicking "I have a problem with [Service]".
- Social Media Tracking: Automated analysis of social media posts mentioning connection errors and service downtime.
- Network Telemetry: Aggregated telemetry data from web monitoring services.
Step-by-Step Guide: How to Check Any Service Status
- Visit the official Downdetector homepage in your web browser.
- Type the service or app name into the search bar at the top (e.g., WhatsApp, Netflix, YouTube, Xbox Live).
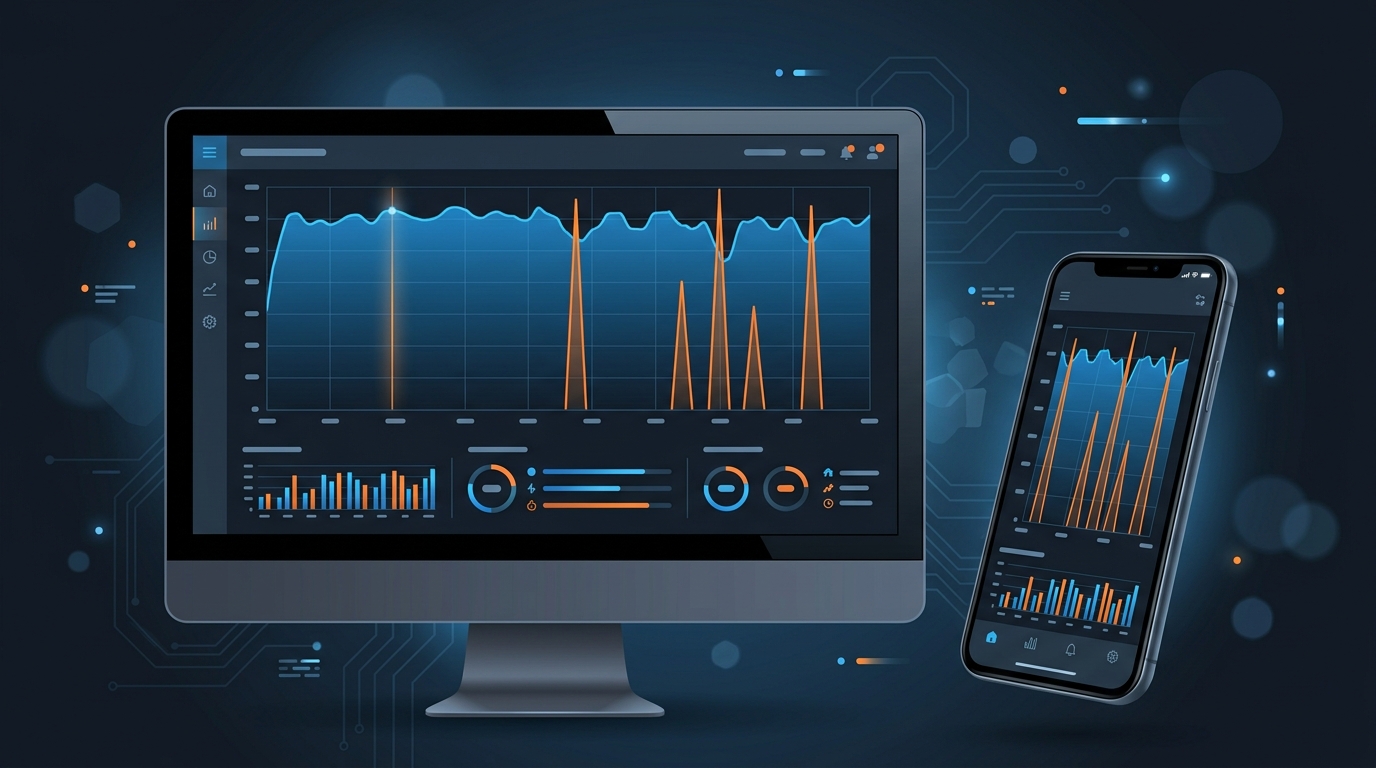
- Review the **Problem Reports Chart**: The baseline shows typical report levels over 24 hours. A red spike far above the baseline confirms an active service outage.
- Examine the outage map and most reported problem categories (e.g., *Server Connection, App Crash, Login*).
DomineTec Tip: If Downdetector shows no report spikes for a service you cannot access, the issue is likely on your local network. Restart your router or switch your device's DNS settings.
Behind the Scenes: Outage Tracking Mechanisms
When you rely on digital platforms for work, entertainment, or communication, sudden downtime can be highly disruptive. While Downdetector provides an accessible front-end for users to verify outages, the underlying mechanisms of global internet monitoring involve complex protocols and tracking techniques. The internet is a massive, interconnected network of servers, data centers, and fiber-optic cables, meaning a failure at any node can trigger localized or global service disruptions. Outage tracking systems utilize a combination of active and passive monitoring to pinpoint exactly where the fault lies.
Active monitoring, often referred to as synthetic testing, involves deploying automated bots or scripts from various geographical locations worldwide. These bots continuously send simulated requests—such as attempting to log in, loading a video stream, or querying a database—and measure the response time and error rates. If a significant percentage of these automated tests fail or timeout, the tracking mechanism flags a potential service degradation. This proactive approach helps system administrators identify latency issues before they cascade into complete blackouts.
Passive monitoring, on the other hand, involves analyzing real user traffic and external routing data without injecting artificial requests into the network. This includes monitoring BGP (Border Gateway Protocol) route changes, which map the paths data packets take across the internet backbone. A sudden withdrawal of BGP routes often indicates a massive infrastructural failure, such as a cut submarine cable or a major data center going offline. By aggregating passive network telemetry with crowdsourced reports, platforms can differentiate between an application-layer bug (like a faulty app update) and a fundamental network layer collapse.
Furthermore, major cloud providers (AWS, Google Cloud, Azure) power significant portions of the web. Outage tracking platforms often integrate with the status APIs of these foundational hosts. If an entire availability zone in a cloud provider goes down, the monitoring system can automatically deduce that thousands of downstream websites and applications hosted in that zone will also experience downtime. This multi-layered approach to tracking ensures a comprehensive understanding of digital outages in real time.
First Line of Defense: Essential Network Diagnostic Steps
Before assuming that a major service like Netflix, WhatsApp, or a banking application is experiencing a global outage, it is crucial to eliminate your own local network as the source of the problem. Many perceived website outages are actually localized connectivity issues, Wi-Fi interference, or hardware glitches within the user's home or office environment. Mastering fundamental network diagnostic steps can save time and frustration.
The first and simplest diagnostic step is isolating the connection type. If a website fails to load on your laptop connected to Wi-Fi, test the same site on your smartphone using cellular data (with Wi-Fi disabled). If the site loads flawlessly on cellular networks but fails on your broadband connection, the issue is definitively isolated to your Internet Service Provider (ISP), your home router, or local network configuration, rather than a global service failure.
For more detailed diagnostics, operating systems come equipped with powerful command-line utilities. The ping command is the foundational tool for connection testing. By opening your command prompt or terminal and typing ping google.com, you instruct your computer to send small data packets (ICMP echo requests) to the target server. The server then responds, and the utility calculates the round-trip time in milliseconds. Consistent timeouts or high packet loss indicate an unstable connection between your device and the destination server.
If the ping test fails or shows severe latency, the next step is utilizing the traceroute utility (typed as tracert on Windows and traceroute on macOS/Linux). This command maps the exact journey your data takes as it hops from your router, through various ISP gateways, across the internet backbone, and finally to the destination server. By analyzing the traceroute output, you can identify exactly which node is causing the bottleneck. If the connection fails at the very first hop, your local router is malfunctioning. If it fails several hops down the line, an ISP peering issue is likely the culprit.
The Nameserver Nuance: Deep Dive into DNS Troubleshooting
One of the most common reasons a single website appears to be down while the rest of the internet works perfectly is a Domain Name System (DNS) failure. The DNS acts as the phonebook of the internet, translating human-readable domain names (like example.com) into the numerical IP addresses (like 192.0.2.1) that computers use to communicate. If your designated DNS server is slow, outdated, or offline, your browser will fail to locate the website, presenting errors such as DNS_PROBE_FINISHED_NXDOMAIN.
By default, most home connections rely on the DNS servers automatically assigned by their Internet Service Provider. Unfortunately, ISP-provided DNS servers are notoriously unreliable, prone to congestion, and slow to update their records when a website changes hosting providers. When an ISP's DNS goes down, it can mimic a massive internet outage, even though the underlying websites are perfectly healthy and accessible via their direct IP addresses.
The immediate fix for suspected DNS issues is clearing your local DNS cache. Operating systems temporarily store DNS lookups to speed up future requests, but this cache can become corrupted or outdated. On Windows, you can flush the cache by opening the Command Prompt as an administrator and typing ipconfig /flushdns. On macOS, opening the Terminal and executing sudo dscacheutil -flushcache; sudo killall -HUP mDNSResponder accomplishes the same goal. This forces your system to perform a fresh lookup the next time you try to access the site.
If flushing the cache does not resolve the issue, transitioning to a more robust, public DNS provider is highly recommended. Services like Google Public DNS (8.8.8.8 and 8.8.4.4) or Cloudflare (1.1.1.1 and 1.0.0.1) offer significantly faster resolution times, enhanced privacy features, and global redundancy. By changing the DNS settings in your network adapter properties or directly within your router's administration panel, you bypass ISP-level DNS failures entirely, often restoring access to "down" websites instantly.
DomineTec Tip: Implementing a custom DNS at the router level ensures that all connected devices in your home—including smart TVs, IoT devices, and smartphones—benefit from the improved stability and speed of providers like Cloudflare or Google DNS, eliminating device-by-device configuration.
Is It You or Them? Analyzing ISP Performance and Throttling
In certain scenarios, a website or application may appear degraded or entirely inaccessible not due to a global outage, but because of intentional or unintentional actions taken by your Internet Service Provider. ISPs manage vast, complex networks and employ various traffic management strategies that can severely impact the end-user experience, sometimes mimicking the symptoms of a server-side outage.
Bandwidth throttling is a common ISP practice that can lead to perceived outages, particularly for high-bandwidth applications like streaming services or massive multiplayer online games. During peak usage hours, an ISP might intentionally slow down specific types of traffic to prevent network congestion. If Netflix continuously buffers while text-based websites load instantly, your ISP might be throttling video traffic. This selective degradation can easily be mistaken for a platform outage on the user's end, even though Downdetector might show no widespread issues.
Furthermore, localized ISP routing issues can completely sever connections to specific data centers. The internet relies on complex peering agreements between different service providers to pass traffic globally. If a peering link between your local ISP and a major transit provider fails, a substantial portion of the internet might suddenly become unreachable for users in your region, while remaining perfectly functional for the rest of the world. Checking your ISP's official status page or community forums can help verify if a regional routing failure is occurring.
To definitively determine if an ISP is intentionally throttling traffic or suffering from a regional routing black hole, utilizing a Virtual Private Network (VPN) is an effective diagnostic strategy. A VPN encrypts your internet traffic and routes it through a secure tunnel to a remote server, completely hiding the nature and destination of your data from your ISP. If connecting to a VPN suddenly restores full speed and access to a previously "down" service, it confirms that the bottleneck or block is actively occurring at the ISP level, not at the service provider's end.
Advanced Utility Tips: Becoming a Connection Detective
For power users, IT professionals, or individuals seeking precise answers beyond what basic tools offer, advanced diagnostic utilities provide unparalleled insight into network connectivity and website health. Rather than simply waiting for a service to return, these methods allow you to pinpoint exactly where the handshake between your browser and the remote server is failing, offering a deeper understanding of web infrastructure.
The browser's built-in Developer Tools (accessed by pressing F12 in Chrome, Edge, or Firefox) are indispensable for diagnosing web application failures. Navigating to the "Network" tab and reloading the problematic page allows you to see every individual request the browser makes for scripts, images, and data. Analyzing the HTTP status codes returned can immediately identify the problem's nature. For instance, a 500 Internal Server Error points to a backend crash on the website's server, a 502 Bad Gateway suggests a proxy or load balancer failure, and a 503 Service Unavailable indicates the server is intentionally rejecting connections due to overload or maintenance.
Another powerful, albeit older, utility is Telnet. While the ping command checks if a server is reachable, it only uses ICMP packets, which some servers block for security reasons. Telnet allows you to test connectivity to a specific port on a server. For example, typing telnet example.com 443 attempts to establish a raw TCP connection to the standard HTTPS port. If the connection opens successfully (usually presenting a blank screen), it proves the server is actively listening for secure web traffic, ruling out massive firewall blocks or complete server death.
Finally, for those managing crucial infrastructure or simply wanting continuous oversight, deploying personal uptime monitoring tools is highly beneficial. Open-source solutions like Uptime Kuma can be hosted on a small home server or a cheap cloud instance. These tools allow you to configure custom, minute-by-minute checks on your most important services via HTTP, Ping, or DNS queries. Instead of manually checking Downdetector, your personal monitor can instantly dispatch an email, Telegram message, or Discord webhook the second a critical application fails to respond, transforming you from a reactive user into a proactive network administrator.
DomineTec Tip: When dealing with persistent connectivity issues that affect multiple devices, always consider testing a wired Ethernet connection directly to your modem. Bypassing wireless routers and local switches quickly eliminates local hardware failure as a potential variable.
Conclusion: Navigating the Digital Landscape with Confidence
Experiencing sudden digital disconnections can be alarming, especially in an era where professional and personal lives are inextricably linked to cloud services. While platforms like Downdetector provide invaluable crowd-sourced insights into the global status of major applications, relying solely on user reports is only the first step in effective troubleshooting. A comprehensive understanding of the digital infrastructure allows users to move past simple frustration and actively diagnose the root cause of connection failures.
By learning to differentiate between local network malfunctions, DNS resolution errors, ISP throttling, and genuine server-side catastrophes, you empower yourself to resolve issues efficiently. Whether it means quickly flushing a corrupted DNS cache, switching to a more reliable public nameserver, or utilizing command-line utilities to trace network bottlenecks, these skills are essential for the modern internet user. The next time a crucial service refuses to load, you will have the knowledge and tools necessary to accurately identify the problem and, in many cases, implement a robust solution.
Frequently Asked Questions
Is Downdetector free to use?
Yes. Accessing Downdetector to search and view real-time service status charts is completely free and requires no account registration.
What is the difference between Downdetector and official status pages?
Official status pages are manually updated by companies. Downdetector reflects real-time user-reported experience during outages.